How to Use RS232 Sniffer Software?
1. Download, install and launch COM Port Monitor.
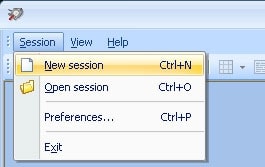
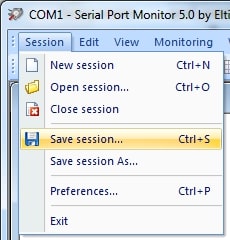
2. Choose “Session >>> New session” from the main menu. You can also use the keyboard shortcut “CTRL+N” or click “New” on the main toolbar.

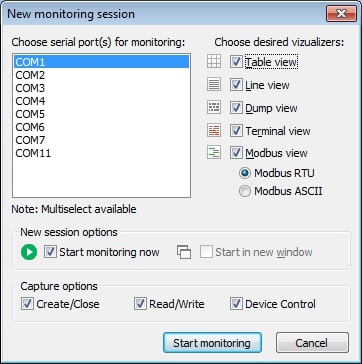
3.The “New monitoring session” window will open.

Make your selection of the visualizers that will be used to display data during the monitoring session. The choices are:
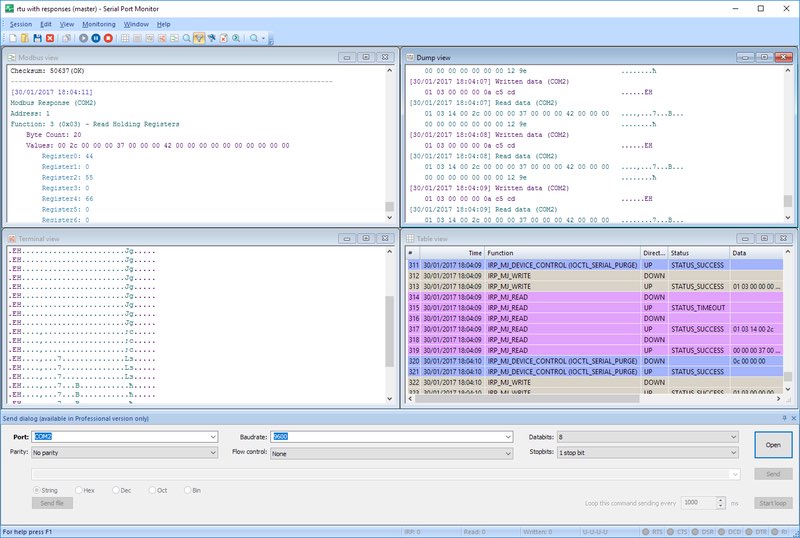
- Terminal view presents the captured data as ASCII characters in a text console.
- Line view displays detailed information about the requests that are sent on a specific serial line.
- Table view presents a table of the recorded IRPs.
- Dump view displays all data received and sent on a particular serial line.
- Modbus view displays received and sent Modbus data in both the RTU and ASCII formats.
Use the checkboxes designated as “Start monitoring now” and “Start in new window” to control the initiation of your new monitoring session.
Capture options: select the options you want to be monitored during the session from these choices: Create/Close,
Read/Write, and Device Control.
After setting the options begin monitoring in the new session by clicking the “Start monitoring” button.
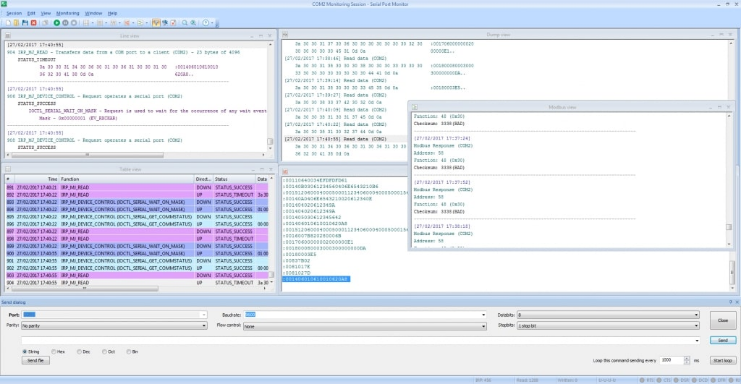
4. A new monitoring window will be opened using the visualizers you previously selected.

In the Status bar tune the settings you need.

- nBaudRate : Defines serial port BaudRate. Possible values are: 110, 300, 600, 1200, 2400, 4800, 9600, 14400, 19200, 38400, 56000, 57600, 115200, 128000 and 256000. By default, 110 value is taken.
- nDataLength : Defines data lengths in a packet. Possible values are: 5, 6, 7 and 8. The default value is 7 bits.
- cParity : Defines parity in one of the following values: (E)ven, (O)dd, (M)ark, (S)pace, or (N)one. By default (N)one is taken.
- nStopBits : Defines a number of stop bits. Possible values are: “1”, “1,5” and “2”. The default value is “1”.
- cHandflow : Defines flow control value. Possible values are: Hardware (P), Xon/Xoff (X) and None. The default value is None.
Serial/modem control lines state:
- RTS : Request to Send line indicator
- CTS : Clear to Send line indicator
- DSR : Data Send Ready line indicator
- DCD : Data Carrier Detect line indicator
- DTR : Data Terminal Ready line indicator
- RI : Ring line indicator
Serial Port Sniffer displays line levels graphically via colored circles. A green circle indicates a high line level with a red circle standing for a low level. An undetermined state is specified by a gray circle.
5. Save a session by choosing “Session >>> Save session/Save session As” from the main menu. You can also use the CTRL+S keyboard shortcut or click “Save” on the main toolbar.

6. Select a file name when prompted by the application. You can make use of this file to reload it for later analysis or to continue the monitoring session.
As you can see, the COM Port Sniffer for Windows can be instrumental in solving serial communication problems in many different industries. The tool can save time and money for developers of serial applications and devices.
It can be challenging to implement an RS232 sniffer in the absence of a quality tool. Luckily, Electronic Team has you covered with a comprehensive and intuitive serial port sniffer tool that will effectively address your serial communication issues.

