Cookie
Electronic Team, Inc. uses cookies to personalize your experience on our website. By continuing to use this site, you agree to our cookie policy. Click here to learn more.

Serial Port Debugger: RS232 troubleshooting guide

Try Serial Port Debugger
14-day free trial

Table of contents:

  1. Software issues
  2. Hardware troubles


The RS232 serial communication protocol is the most widely used method of controlling professional audio/video equipment in signal management systems. The standard is used to control dimmers, switches, amplifiers, and projectors as well as any other vital system components.

This article is intended to provide a basic understanding of the fundamentals of the RS232 connection that can be used to diagnose and address problems in serial connectivity. Most of the issues you will encounter can be resolved quickly if you know the operating principles of the protocol and where to look when you encounter a COM port error. If you want to know more about how to fix serial port problems, read on.

Two types of issues can give you trouble when using serial connections. Some are caused by software conflicts while other kinds of COM port problems are caused by hardware incompatibility or connectivity complications.

Software issues


Let’s take a look at serial port troubleshooting when the underlying issue is caused by software.

Common settings


To perform serial port communication troubleshooting, you may need to reconfigure the communication settings that control data transfer. Some of the settings you need to look at are Parity, DataBits, StopBits, and BaudRate. Both ends of a serial communication implementation need to have their parameters set in the same way. You can gain more information about configuration settings in the RS232 port review.

Serial Port Debugger

Serial Port Debugger is a professional utility that provides users with the ability to start monitoring any serial port available in a system. It helps track down communication problems and resolve them immediately.
Serial Port Monitor logo

Serial Port Monitor

Log and analyze serial port activity
4.8 Rank based on 345+ users, Reviews(345)
Download 14-day fully-functional trial period
Serial Port Monitor

To adequately perform serial port debugging it is advisable to have a great tool to assist you. RS232 Monitor is a software application that helps you identify and diagnose serial communication errors. With this RS232 debugging software you can easily track down the problem and get it fixed.

For serial communication to operate successfully, both ends of the conversation need to employ identical software settings. An example is where both the controlling and controlled device have the same parity setting or use the same BaudRate. Failure to set these correctly will disable the serial transmission.

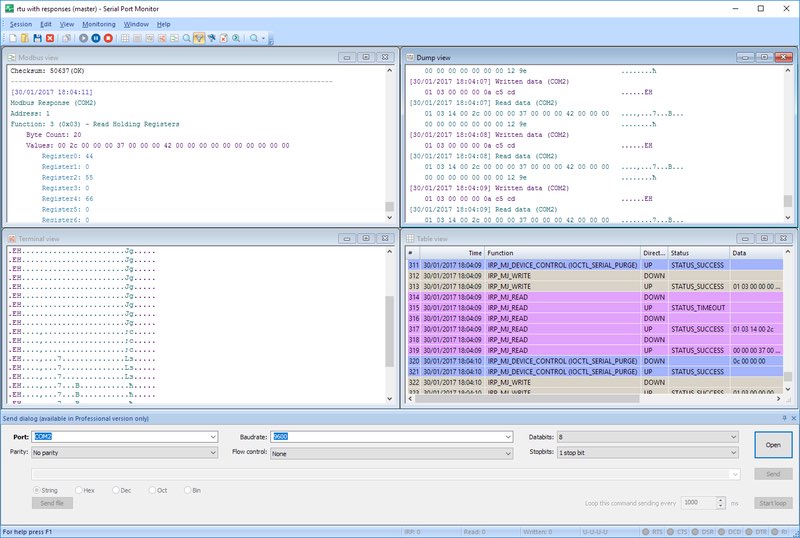
You can find and set these parameters in the software’s status bar which provides information about the serial port and signal lines.

COM Port status bar

Serial port control information:

  • nBaudRate: Defines the serial port baud rate. Possible values are: 110, 300, 600, 1200, 2400, 4800, 9600, 14400, 19200, 38400, 56000, 57600, 115200, 128000 and 256000. By default, 110 value is taken.
  • nDataLength: Defines data lengths in a packet. Possible values are 5, 6, 7 and 8. The default value is 7 bits.
  • cParity: Defines parity in one of the following values: (E)ven, (O)dd, (M)ark, (S)pace, or (N)one. By default (N)one is taken.
  • nStopBits: Defines a number of stop bits. Possible values are: “1”, “1,5” and “2”. The default value is “1”.
  • cHandflow: Defines flow control value. Possible values are Hardware (P), Xon/Xoff (X) and None. The default value is None.

Serial/modem control lines state:

  • RTS: Request to Send line indicator
  • CTS: Clear to Send line indicator
  • DSR: Data Send Ready line indicator
  • DCD: Data Carrier Detect line indicator
  • DTR: Data Terminal Ready line indicator
  • RI: Ring line indicator

The gray circle stands for the undetermined state. The red circle stands for a low line level, and the green circle stands for a high line level.

RS232 debug software: user manual


Once you have configured the settings in the software you can start using COM Port Debugger to collect data from your system’s COM ports. Follow these steps to start start monitoring serial data:

1. Launch Serial Data Debugger.

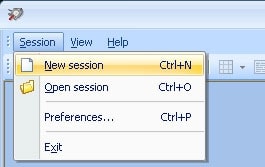
2. Choose “Session >>> New session” from the main menu, use the CTRL+N shortcut or click “New” on the main toolbar.

New session

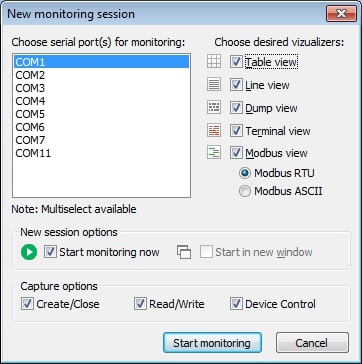
3. The “New monitoring session” window will be displayed:

New monitoring session

Select how you want to view your data using the visualizers that will be employed during the session.

  • Line view displays detailed information about the data transmitted through a specific serial line.
  • Terminal view displays the data as ASCII characters in a text console.
  • Table view displays recorded IRPs in a table format.
  • Dump view displays all of the sent and received data passed through the serial line.
  • Modbus view displays received and sent Modbus data (RTU and ASCII).

By using the “Start monitoring now” and “Start in new window” checkboxes you can control the characteristics of a new monitoring session.

Capture options allow you to determine which events you wish to monitor from these choices: Create/Close, Read/Write or Device Control.

4. Click “Start monitoring” to start the new monitoring session after selecting the settings.

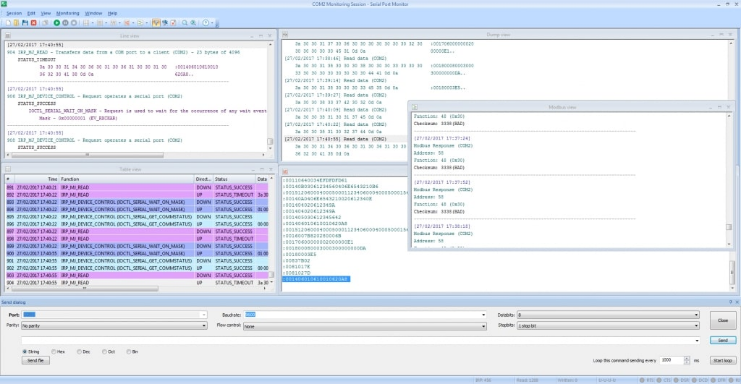
A new monitoring window will be opened by the RS232 Debugger, displaying the data using the previously selected visualizers.

The process of monitoring

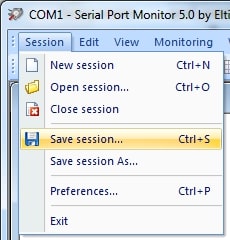
5. Save a session by choosing “Session >>> Save session/Save session As” from the main menu. You can also or click “Save” on the main toolbar, or press the CTRL+S keyboard shortcut.

Save testing session
Try COM Port Debugger now
14-day free trial

Hardware troubles


Cables


Cables can pose a potential source of an RS232 error. Correctly cabling the device to the serial interface is essential to creating a viable connection.

A common problem when technicians attempt to debug RS232 issues is that the wiring between the control system and the device has not been done correctly.

Most control systems only require that two wires are connected to the controlled device. This connection is between the Transmit (XMT) and Ground (GND) pins on the control system which are connected to the controlled device’s Receive (RCV) and Ground (GND) pins.

Controlled device

A third wire is employed when the controlled device is expected to send a response to the controller. If you are using a computer’s serial port to control peripheral equipment, this is the standard wiring diagram.

Standard wiring diagram

The type of cable that you use can impact the ability to create a serial communication channel. You might need to use either a straight-through cable or a null-modem cable. Straight-through cables are equipped with a male connector at one end and a female connector on the other side. A female connector is on both ends of a null-modem cable. You need to use the correct cable for your application or you will not successfully set up connectivity.

Wiring


Incorrect wiring can be the source of errors when connecting a device to its control system.

When terminal block type connectors are used, you can test the voltage with a voltmeter. This will help determine if the connection has been correctly implemented.

With the interconnecting cable in place and the voltmeter set to "DC", test the voltage between the RCV pin and the GND pin on the terminal block connector. You should look for a reading that falls between_12V and _6V. The XMT line should have the same reading.

Correct connection

If you have connected the lines between the control system and the controlled device and the voltmeter displays a steady reading of 0 volts, there is a high probability that you have the Receive and Transmit lines reversed (Fig. 4).

Incorrect connection

Serial Port Monitor is a professional-grade serial port debugging tool that will prove instrumental in troubleshooting and resolving problems with serial communication. This COM port debugging tool deserves to be part of your software arsenal if you work with serial interfaces and devices.

small logo Serial Port Monitor
#1 at Serial Port Software
Serial Port Monitor
Log and analyze serial port activity
4.8 rank based on 345+ users (Learn more)
Get a download link for your desktop
Submit your email address to get a link for quick download on your desktop and get started!
or