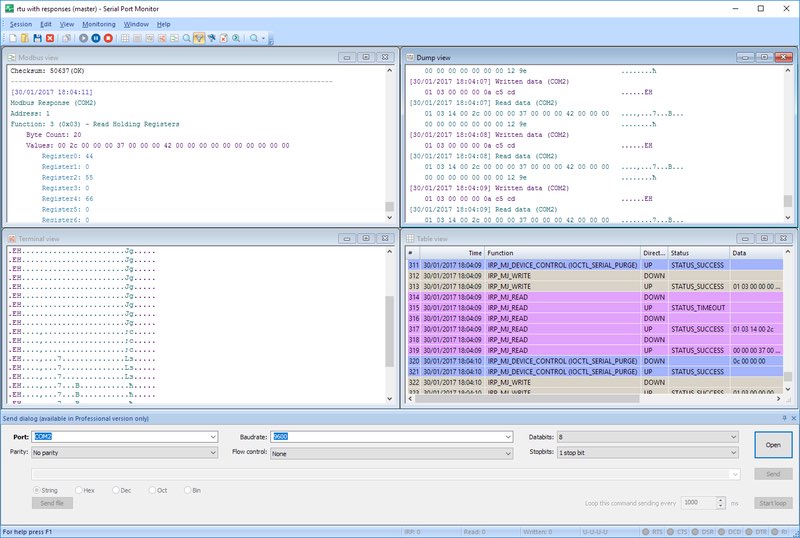
Tracking down a problem that might appear during the development stage of the custom application or a driver for a COM device and dealing with it in the shortest time would not be possible without the ability to capture serial data and store it for later use and analysis.
Unfortunately, Windows does not offer any built into the OS utilities that would help achieve this. So, one would need to resort to the help of a specialized Serial port Monitor that would assist with capturing and examining the data exchange between RS232 devices and Windows applications.
This article will show you how to capture serial port data and identify key serial communication settings such as baud rate, COM port number, stop bits, data bits, and parity. This information is especially important for testing COM ports.


